In this lesson, students will explore and record data about different plants …
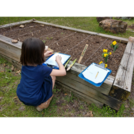
In this lesson, students will explore and record data about different plants that they observe. Students will then create a bar graph to reflect the data that that they collected. For example, a student might find 7 tomato plants, 5 cabbages, and 4 squash plants; their graph would reflect these numbers.
STUDENT ACTIVITY - 4th - NCThis is a distance-learning lesson students can …
STUDENT ACTIVITY - 4th - NCThis is a distance-learning lesson students can complete at home. The student will explore and record data about different plants that they observe. Then they will create a bar graph to reflect the data that that they collected. This activity was created by Out Teach (out-teach.org), a nonprofit providing outdoor experiential learning to transform Science education for students in under-served communities.
In this lesson, students will explore and record data about different plants …
In this lesson, students will explore and record data about different plants that they observe. Students will then create a bar graph to reflect the data that that they collected. For example, a student might find 7 tomato plants, 5 cabbages, and 4 squash plants; their graph would reflect these numbers.
No restrictions on your remixing, redistributing, or making derivative works. Give credit to the author, as required.
Your remixing, redistributing, or making derivatives works comes with some restrictions, including how it is shared.
Your redistributing comes with some restrictions. Do not remix or make derivative works.
Most restrictive license type. Prohibits most uses, sharing, and any changes.
Copyrighted materials, available under Fair Use and the TEACH Act for US-based educators, or other custom arrangements. Go to the resource provider to see their individual restrictions.